Net change in stocks is a fundamental concept in the financial markets. It represents the difference between the closing price of a stock on the current trading day and its closing price on the previous trading day. This metric is widely used by investors, traders, and analysts to assess price movements and market trends. Understanding net change is crucial for making informed investment decisions, as it provides insights into the performance of individual stocks and broader market indices.
The financial markets are dynamic, with stock prices fluctuating constantly due to various factors such as economic data, corporate earnings, geopolitical events, and investor sentiment. Net change helps market participants quickly gauge whether a stock has gained or lost value over a specific period. While the concept may seem simple, its implications are far-reaching, influencing trading strategies, portfolio management, and risk assessment.
This essay explores the definition, calculation, significance, and practical applications of net change in stocks. It also examines the factors that influence net change and how investors can use this metric to enhance their decision-making processes. By the end of this discussion, readers will have a comprehensive understanding of why net change matters in the world of finance.
Definition of Net Change
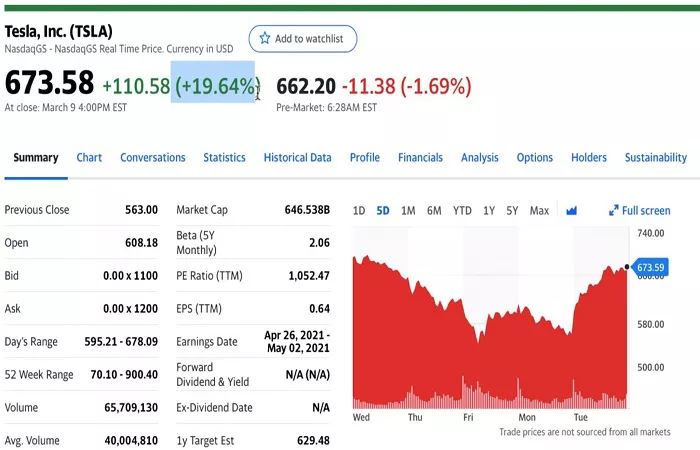
Net change refers to the difference between the closing price of a stock on one trading day and its closing price on the previous trading day. It is expressed as a numerical value, which can be positive, negative, or zero. A positive net change indicates that the stock’s price has increased, while a negative net change signifies a decline. A net change of zero means there was no price movement between the two trading sessions.
For example, if a stock closes at 52 on Tuesday, the net change is +48 on Wednesday, the net change from Tuesday to Wednesday is -$4. This simple calculation allows investors to track price movements efficiently.
Net change is often displayed alongside other key stock metrics, such as the percentage change, volume, and bid-ask spread. While percentage change provides a relative measure of price movement, net change offers an absolute value, making it easier to compare price differences across stocks with varying price levels.
Calculation of Net Change
The formula for calculating net change is straightforward:
Net Change = Current Closing Price – Previous Closing Price
This calculation can be applied to individual stocks, exchange-traded funds (ETFs), or market indices. For instance, if the S&P 500 index closes at 4,500 today and 4,480 yesterday, the net change is +20 points.
While the basic formula remains the same, investors should be aware of adjustments that may affect net change. Corporate actions such as stock splits, dividends, and mergers can alter a stock’s price history. In such cases, historical prices are adjusted to ensure consistency, allowing net change calculations to remain accurate over time.
Significance of Net Change
Net change serves as a quick reference for investors to assess market movements. It is particularly useful for short-term traders who rely on daily price fluctuations to make buy or sell decisions. By monitoring net changes, traders can identify trends, spot potential reversals, and execute trades based on momentum.
For long-term investors, net change provides a snapshot of a stock’s performance over time. While daily fluctuations may not significantly impact a buy-and-hold strategy, consistent positive or negative net changes can indicate underlying strength or weakness in a company’s fundamentals.
Additionally, net change is a key component of technical analysis. Chartists use net change data to plot price movements, identify support and resistance levels, and apply technical indicators such as moving averages and relative strength index (RSI). These tools help traders predict future price movements based on historical patterns.
Factors Influencing Net Change
Several factors contribute to the net change in stock prices. Understanding these influences can help investors interpret price movements more effectively.
Economic indicators such as GDP growth, unemployment rates, and inflation data can impact investor sentiment and stock prices. Positive economic news often leads to higher stock prices, while negative reports may trigger sell-offs.
Corporate earnings announcements are another major driver of net change. If a company reports better-than-expected earnings, its stock price typically rises, resulting in a positive net change. Conversely, disappointing earnings can lead to a decline.
Market sentiment, driven by news, rumors, or geopolitical events, also plays a role. For example, political instability or trade tensions can cause sudden price swings, reflected in the net change.
Supply and demand dynamics directly affect stock prices. If more investors want to buy a stock than sell it, the price increases, leading to a positive net change. Conversely, excess selling pressure can drive prices down.
Interest rate changes by central banks influence borrowing costs and corporate profitability. Higher interest rates may negatively impact stocks, while lower rates can stimulate market growth.
Practical Applications of Net Change
Investors and traders use net change in various ways to enhance their strategies.
Day traders rely on intraday net changes to capitalize on short-term price movements. By analyzing net changes in real-time, they can enter and exit positions quickly to lock in profits.
Swing traders use net changes over several days or weeks to identify trends. A series of positive net changes may signal an uptrend, while consecutive negative changes could indicate a downtrend.
Portfolio managers monitor net changes to assess the performance of their holdings. If a stock consistently shows negative net changes, they may reconsider its position in the portfolio.
Analysts use net change data to compare stocks within the same sector or industry. This comparison helps identify outperformers and underperformers, guiding investment decisions.
Limitations of Net Change
While net change is a useful metric, it has limitations that investors should consider.
Net change only reflects price movement between two specific points in time. It does not account for intraday volatility, where a stock may have experienced significant fluctuations before settling at the closing price.
The metric does not provide context on the magnitude of price movement relative to the stock’s historical performance. A 50 stock but negligible for a $500 stock.
External factors such as market manipulation or low liquidity can distort net change. Thinly traded stocks may exhibit exaggerated net changes due to limited trading activity.
Conclusion
Net change in stocks is a simple yet powerful tool for assessing price movements. It provides investors with a clear measure of how much a stock’s price has moved from one trading session to another. By understanding net change, market participants can make more informed decisions, whether they are day traders, long-term investors, or financial analysts.
While net change offers valuable insights, it should not be used in isolation. Combining it with other metrics such as percentage change, volume, and technical indicators can provide a more comprehensive view of market trends. Additionally, investors must consider the broader economic and corporate factors that influence stock prices.
In the fast-paced world of finance, net change serves as a quick and efficient way to gauge market sentiment and stock performance. By mastering this concept, investors can enhance their ability to navigate the complexities of the financial markets and achieve their investment goals.
Related topics: