The stock market is a complex system where prices fluctuate constantly. Investors and traders need to understand key terms to make informed decisions. One such term is a “point.” A point in stocks represents a unit of price movement. The value of a point varies depending on the asset being traded. For stocks, a point typically equals one dollar. However, for indices like the S&P 500 or the Dow Jones Industrial Average, a point has a different meaning.
This essay explores the concept of a point in stocks. It explains how points work in different financial instruments. It also discusses why understanding points is crucial for investors. The discussion includes examples and comparisons to clarify the topic. By the end, readers will have a clear understanding of how much a point is worth in various market contexts.
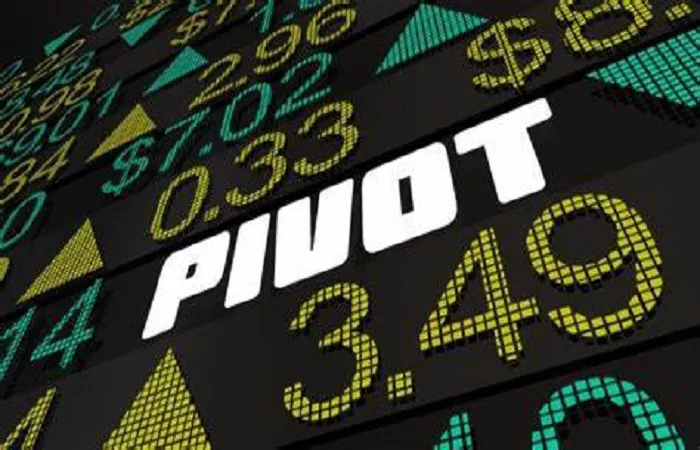
What Is a Point in Stocks?
A point in stocks refers to a one-dollar change in the price of a single share. If a stock moves from 51, it has gained one point. Similarly, if it drops from 49, it has lost one point. This definition applies to individual stocks traded on exchanges like the New York Stock Exchange (NYSE) or Nasdaq.
Points are used to measure price movements. They help investors track gains and losses quickly. For example, if an investor owns 100 shares of a stock that rises by two points, their position increases in value by $200. Understanding points is essential for calculating profits and losses accurately.
Points in Stock Indices
Stock indices like the Dow Jones Industrial Average (DJIA) and the S&P 500 also use points. However, the meaning differs from individual stocks. In indices, a point represents a numerical change in the index value, not a dollar amount.
The Dow Jones Industrial Average is a price-weighted index. A one-point move in the Dow means the average price of its 30 component stocks has changed by one dollar. Since the Dow is an average, the impact of a point depends on the stock prices within the index.
The S&P 500 is a market-cap-weighted index. A point here reflects a broader market movement. If the S&P 500 rises by 10 points, it means the index value has increased by 10 units. The dollar value of a point in the S&P 500 depends on the index level. For example, if the S&P 500 is at 5,000, a one-point move represents a 0.02% change.
Points in Futures and Options
Futures and options contracts also use points. In futures trading, a point represents a standardized price movement. The value of a point depends on the contract specifications.
For example, in E-mini S&P 500 futures, one point equals 50. Traders must understand these point values to manage risk effectively.
Options contracts use points to measure premium changes. A one-point move in an option premium equals one dollar per share. Since options control 100 shares, a one-point change in the premium translates to a $100 change in the contract value.
Why Points Matter in Trading
Points are crucial for traders and investors. They provide a simple way to track price movements. By understanding points, traders can calculate potential profits and losses.
For example, a swing trader might buy a stock at 105. A five-point gain would mean a $500 profit on 100 shares. Without understanding points, the trader might misjudge the trade’s potential.
Points also help in risk management. A trader using stop-loss orders must know the dollar value of a point. If a stock is at 48, a two-point drop would trigger the order. Knowing the dollar value helps the trader assess the risk per trade.
Calculating the Value of a Point
The value of a point depends on the position size. For stocks, one point equals one dollar per share. If an investor owns 1,000 shares, a one-point move changes the position value by $1,000.
For indices, the calculation is different. The dollar value of a point in an index depends on the contract or investment vehicle. In index futures, the value is fixed. In index funds or ETFs, the value depends on the fund’s structure.
For example, the SPDR S&P 500 ETF (SPY) is designed to track the S&P 500. If the S&P 500 moves by one point, SPY will move proportionally. Since SPY is priced at roughly one-tenth of the S&P 500, a one-point move in the index may result in a $0.10 change in SPY.
Points vs. Percentages
Points and percentages both measure price changes, but they serve different purposes. Points show absolute changes, while percentages show relative changes.
A stock rising from 101 gains one point, or 1%. A stock rising from 11 also gains one point, but the percentage change is 10%. Traders must consider both points and percentages to assess performance accurately.
For indices, percentages provide context. A 100-point drop in the Dow may seem significant, but if the index is at 35,000, it represents less than 0.3%. Understanding both points and percentages helps investors interpret market movements correctly.
Common Misconceptions About Points
Many investors confuse points with pips or ticks. A pip is a unit of movement in forex trading, while a tick represents the smallest price change in futures. Points are specific to stocks and indices.
Another misconception is that all points have the same dollar value. As discussed earlier, the value varies by asset. A one-point move in a stock is 50 or more.
Some investors also assume that points alone determine profitability. While points measure price changes, transaction costs, leverage, and position size also affect returns. A trader must consider all factors, not just points.
Practical Examples of Points in Trading
To illustrate the importance of points, consider these examples.
An investor buys 500 shares of Company XYZ at 22, a two-point gain. The profit is 2).
A trader buys an E-mini S&P 500 futures contract at 4,000. The index rises to 4,010, a 10-point gain. Since each point is worth 500.
An options trader buys a call option with a premium of 4, a one-point gain. Since options control 100 shares, the profit is $100.
These examples show how points translate into dollar values. Traders must understand these calculations to make informed decisions.
The Role of Points in Technical Analysis
Technical analysts use points to identify trends and patterns. Chartists track point movements to spot support and resistance levels.
For example, if a stock repeatedly bounces off 50 by a few points may signal a downtrend. Analysts use these observations to predict future price movements.
Points also help in setting price targets. If a stock breaks out from 105, an analyst might project a further five-point rise to $110. Understanding points allows traders to set realistic targets.
Points in Long-Term Investing
Long-term investors may not focus on daily point movements. However, understanding points helps in portfolio evaluation.
For example, an investor holding a diversified portfolio tracks the S&P 500. A 100-point drop in the index may prompt a review of asset allocation. While short-term fluctuations are normal, significant point drops may indicate broader market trends.
Points also help in comparing investments. If two stocks gain 10 points over a year, but one started at 100, the percentage returns differ. Investors must consider both points and percentages for accurate comparisons.
The Impact of Leverage on Points
Leverage amplifies the effect of point movements. A leveraged ETF or margin account increases both gains and losses.
For example, a 2x leveraged S&P 500 ETF aims to double the daily point movement of the index. If the S&P 500 rises by 10 points, the ETF should rise by 20 points. However, leverage also magnifies losses, making point movements riskier.
Traders using leverage must understand the dollar value of points. A small point movement can lead to significant gains or losses when leverage is involved.
Points and Market Volatility
Market volatility affects point movements. In highly volatile markets, stocks and indices may experience large point swings.
For example, during earnings season, a stock might jump or drop by several points in a single day. Traders must adjust their strategies to account for increased point volatility.
Indices also experience larger point movements during volatile periods. The VIX, or volatility index, measures expected market volatility. Higher VIX levels often correlate with bigger point swings in the S&P 500.
Conclusion
A point in stocks represents a fundamental unit of price movement. For individual stocks, a point equals one dollar per share. For indices, futures, and options, the value of a point varies. Understanding points is essential for calculating profits, managing risk, and making informed trading decisions.
Points provide a simple way to track price changes, but investors must also consider percentages, leverage, and market conditions. By mastering the concept of points, traders and investors can navigate the financial markets with greater confidence.
In summary, the value of a point depends on the asset being traded. Whether dealing with stocks, indices, or derivatives, knowing how much a point is worth helps in achieving financial success.
Related topics:
- How to Trade Penny Stocks on Robinhood?
- How to Trade Penny Stocks on Robinhood?
- What Is Stock Weight?