Learning to read Forex charts is one of the most important skills for any aspiring trader. Whether you are completely new to the financial world or have some investment experience, understanding the dynamics of chart analysis opens the door to deeper insights and informed trading decisions. This beginner’s guide provides an extensive and easy-to-follow explanation of Forex charts, their types, how to interpret them, and how to use them effectively.
In the Forex market, price movements are represented visually through charts, allowing traders to analyze trends, forecast potential movements, and develop trading strategies. Reading these charts may seem complex at first, but with the right knowledge, anyone can gain proficiency. This guide is specifically tailored to beginners who want to decode charts and build a solid foundation in Forex trading.
What is a Forex Chart?
A Forex chart is a graphical representation of the price movements of currency pairs over a specific time frame. These charts display historical data and provide patterns that help traders identify trends and make decisions. Forex charts can represent data in various formats, such as line, bar, and candlestick charts, each offering unique insights into the market behavior.
Why Are Forex Charts Important?
Forex charts are critical because they allow traders to observe market sentiment, identify trend directions, and detect potential reversal zones. Without charts, traders would be relying on guesswork. With charts, decisions are based on data and visual patterns, helping minimize risk and improve accuracy.
Types of Forex Charts
Line Charts
Line charts are the most basic form of Forex charts. They connect the closing prices of a currency pair over a set period. While line charts are simple and easy to understand, they don’t provide much detail about intraday movements. These are ideal for beginners who want a quick overview of price trends.
Bar Charts
Bar charts provide more detail than line charts. Each bar represents the high, low, opening, and closing prices within a specific time period. This format gives traders a more in-depth view of market activity, showing volatility and daily trading ranges. It helps traders make more informed decisions compared to line charts.
Candlestick Charts
Candlestick charts are the most popular among Forex traders. Each candle displays the open, high, low, and close prices, similar to bar charts, but with more visual clarity. The body of the candle shows the range between opening and closing prices, and the wicks show the high and low prices. Candlestick patterns can indicate market sentiment and potential trend reversals.
Timeframes in Forex Charts
Timeframes determine how long each data point on the chart represents. Common timeframes include 1-minute, 5-minute, 15-minute, hourly, daily, weekly, and monthly charts. Day traders prefer short timeframes for quick trades, while long-term investors use daily or weekly charts. Understanding which timeframe to use depends on your trading style and goals.
Understanding Chart Components
Currency Pairs
All Forex charts are based on currency pairs. The first currency is the base, and the second is the quote. For example, in EUR/USD, EUR is the base and USD is the quote. The chart displays how much of the quote currency is needed to buy one unit of the base currency.
Price Axis and Time Axis
The vertical axis on a Forex chart shows price levels, while the horizontal axis shows time. Together, they allow you to track how the price of a currency pair has changed over time. These axes are crucial for interpreting chart data accurately.
Volume Indicators
Some charts include volume indicators that show how much of a currency pair was traded during a specific period. Although volume data is not as reliable in Forex as in stock markets, it still provides some insights into market interest and participation.
How to Analyze Forex Charts
Identifying Trends
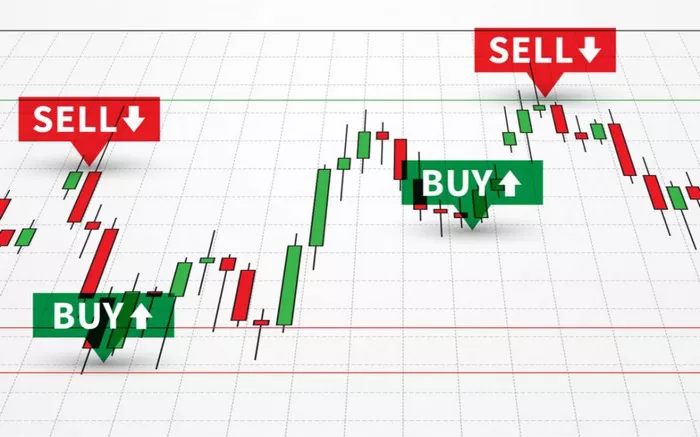
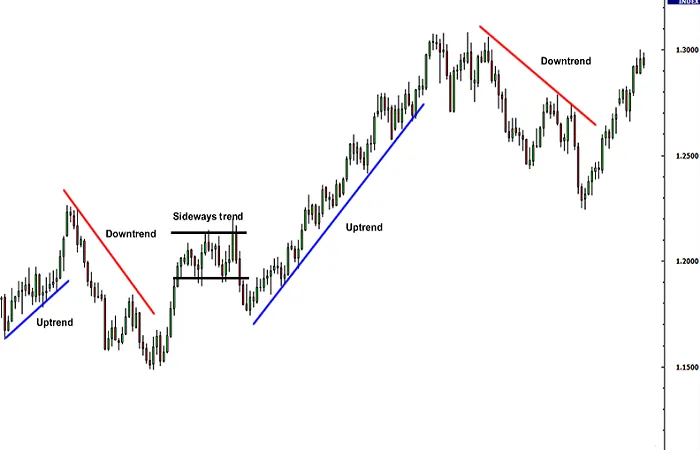
Trends are one of the most important aspects of technical analysis. Uptrends consist of higher highs and higher lows, while downtrends have lower highs and lower lows. Recognizing a trend helps you decide whether to go long (buy) or short (sell).
Support and Resistance Levels
Support levels are price levels where the currency tends to stop falling and may bounce back. Resistance levels are where the price tends to stop rising. These zones are crucial for timing entries and exits.
Using Indicators
Forex traders use various technical indicators like Moving Averages, Relative Strength Index (RSI), and MACD to confirm trends and signals. These tools enhance chart analysis by providing statistical evidence of price behavior.
Common Forex Chart Patterns
Head and Shoulders
This pattern signals a potential reversal. It consists of three peaks: a higher peak (head) between two smaller ones (shoulders). When the price breaks below the neckline, it usually indicates a bearish reversal.
Double Top and Double Bottom
These are reversal patterns. A double top occurs when price reaches a high, falls, and then tests the same high again before reversing. A double bottom is the opposite and signals a bullish trend reversal.
Triangles
Triangles form when price consolidates and the range narrows. There are ascending, descending, and symmetrical triangles. These patterns usually lead to a breakout in the direction of the existing trend.
Practical Tips for Beginners
Start with a Demo Account
Before investing real money, practice with a demo account. Most brokers offer free demo platforms where you can learn to read charts and apply strategies risk-free.
Use Reliable Charting Tools
Platforms like MetaTrader 4, TradingView, and others offer robust charting features. Choose one that provides clear visuals and integrates with your trading preferences.
Keep Learning
The Forex market is dynamic. Continuous education is key. Read articles, take online courses, and follow experienced traders to deepen your understanding.
Emotional Discipline and Risk Management
Understanding charts is only part of successful trading. Emotional control and proper risk management are equally critical. Use stop-loss orders, don’t overleverage, and never risk more than you can afford to lose.
Common Mistakes to Avoid
Beginners often jump into trades without confirmation, rely solely on one indicator, or switch strategies too often. Avoid these pitfalls by staying disciplined and focused on your trading plan.
How Chart Reading Fits into a Trading Strategy
Chart reading should be one component of a broader strategy that includes goal setting, risk assessment, and consistent evaluation. Use charts to identify opportunities, but back them with sound reasoning and evidence.
Conclusion
Learning how to read Forex charts is a fundamental skill for any trader. It equips you with the visual tools to interpret market movements, spot trading opportunities, and avoid costly mistakes. Whether you use line, bar, or candlestick charts, the principles of trend analysis, support and resistance, and chart patterns remain constant. With practice, discipline, and the right educational resources, you can become confident in your ability to read and act on Forex chart data.
Related topics: