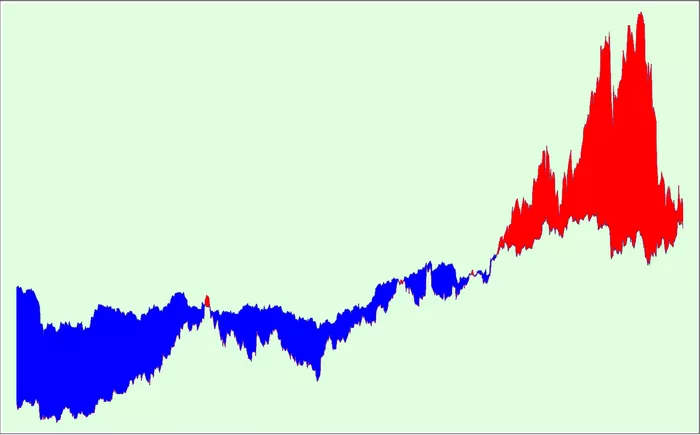
Shares of UnitedHealth Group (UNH) are likely to remain closely watched Monday after the healthcare giant cut its full-year profit forecast due to rising medical costs, causing its stock to suffer its biggest one-day drop since 1998.
The stock’s recent rally toward all-time highs ended abruptly last week, with shares decisively falling below its closely watched 200-week moving average.
Investors should watch key support levels near $439 and $389 on the UnitedHealth chart, while also keeping an eye on key overhead areas near $550 and $606.
Shares of UnitedHealth Group (UNH) are likely to remain closely watched Monday after the company suffered its biggest one-day drop since 1998, as the healthcare giant cut its full-year profit forecast.
The company cited higher-than-expected medical costs as the reason for the earnings cut. The company has faced challenges in recent years due to growing demand for medical services for the elderly and disabled under the government-sponsored Medicare program.
Earlier this month, news that the government would pay health insurers more premiums than previously estimated drove the company’s stock to an all-time high, but the pessimistic outlook may have caught market watchers off guard.
Shares of UnitedHealth Group fell 22% to nearly $454 on Thursday as U.S. markets were closed for Good Friday. The stock has fallen 10% since the beginning of the year, in line with the S&P 500’s decline over the same period.
Below, we take a closer look at UnitedHealth’s weekly chart and use technical analysis to identify key price levels that investors may be tracking.
Closing Below 200-Week Moving Average
UnitedHealth’s recent rally toward an all-time high (ATH) came to a halt last week, as the stock finally closed below its closely watched 200-week moving average. Notably, the sell-off occurred on above-average volume, indicating determined selling by large market players such as institutional investors and hedge funds.
Additionally, the decline also sent the relative strength index (RSI) below the 50 threshold, suggesting that selling momentum is accelerating.
Let’s identify two key support levels on UnitedHealth’s chart that could attract buying interest and point out key overhead areas worth monitoring during a potential uptick.
Key Support Levels to Watch
The first tracing lower level is found around $439. The stock could find support at this level near the February swing low, which is also very close to last April’s low and a minor retracement into November 2021.
If bulls fail to hold this level, shares could fall to downside support at $389. Investors could look for buying opportunities near two troughs formed during the stock’s strong 2021 uptrend.
Key Overhead Areas to Monitor
During the stock’s uptrend, the key $550 level is worth watching. The stock could face considerable selling pressure at this area, which is near several peaks on the chart that date back to April 2022’s notable swing high.
Finally, if shares break out above this area, UnitedHealth Group shares could retest higher levels near $606. This area on the chart could draw a lot of attention around the April high, which is also consistent with a corresponding series of price action below the stock’s all-time high.


